Soil moisture under the forest canopy

November 22, 2026

Satellites read the moisture of the soil almost everywhere on land, but not under dense vegetation: over a forest, most of what they receive comes from the trees. This project developed a way of reading soil moisture there too. The method is published, and its daily maps of the globe are open.

At a glance

  • Theme: Soil moisture under dense vegetation
  • Observations: SMAP microwave brightness at two polarisations; ground stations for checking
  • Approach: The Hybrid Dual-Channel Algorithm (HDCA): soil moisture and two properties of the canopy found together
  • Product: Daily, 36 km, all land, April 2015 to December 2025
  • Status: Published, data open
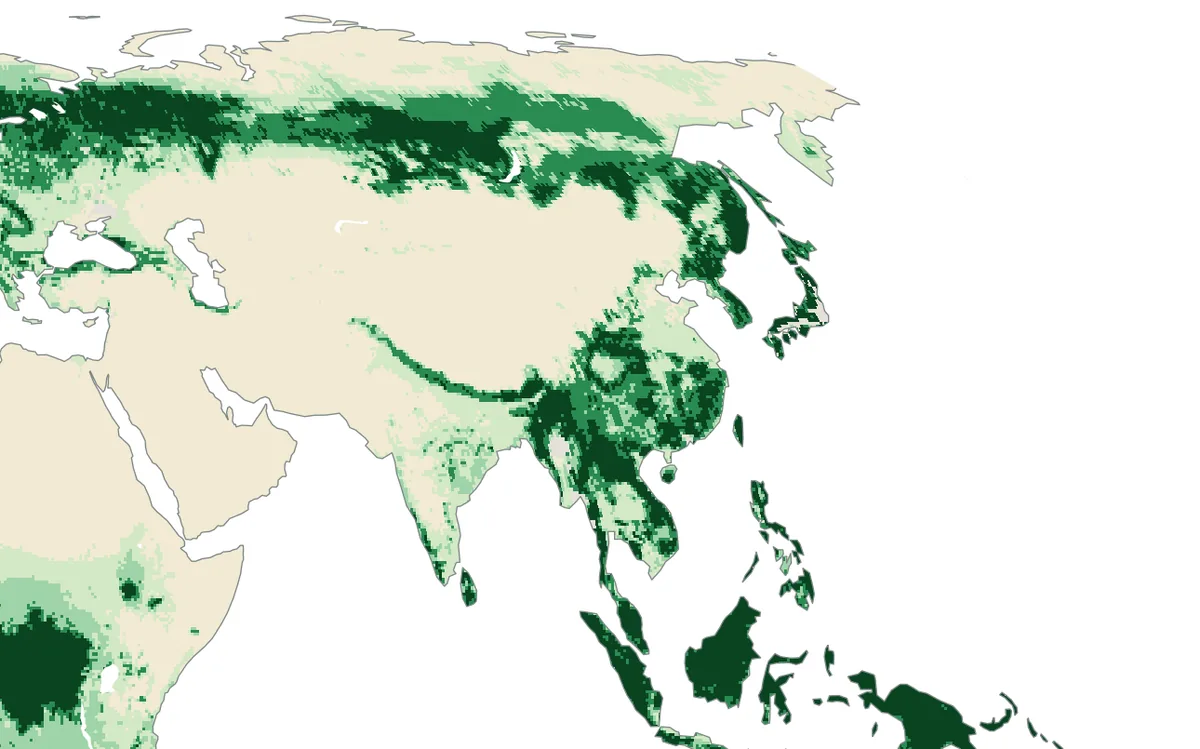
World map of the water held in vegetation above each square metre of ground: less than 1.5 kg over deserts and grassland, about 10 kg in the northern forests and about 18 kg in the rainforests
How much water the vegetation holds above each square metre of ground, as NASA's SMAP mission estimates it. The mission was designed for vegetation of up to 5 kg per square metre. Above that, on about 30 per cent of the land shown, its soil moisture was almost never of recommended quality in 2024. Figure by the lab from public data: NASA SMAP Level-3 soil moisture.

The basics

Everything on the Earth's surface gives off faint microwave radiation, and satellites such as NASA's SMAP measure it from orbit. Wet soil gives off less of it than dry soil, and that is how soil moisture is read from space. Over bare ground the reading is direct. Plants complicate it in two ways: they weaken the radiation that comes up from the soil, and they add radiation of their own, part of it scattered on the way. The satellite receives the sum of the two.

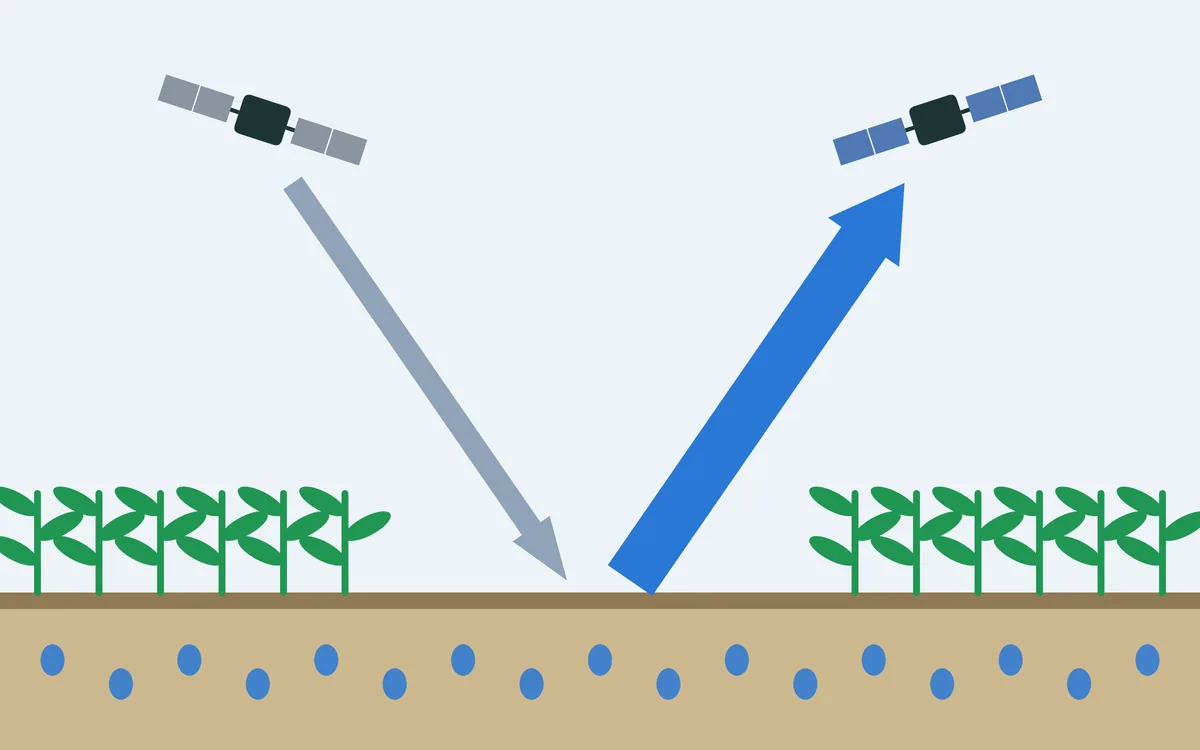
A drawing of three surfaces under a satellite: over bare soil the whole signal comes from the soil; over crops and grass the plants weaken it a little and add a little of their own; over dense forest little of the soil's signal gets through and most of what arrives comes from the trees
What reaches the satellite over bare soil, over crops and grass, and over dense forest. The widths of the arrows show roughly how much comes from the soil and how much from the vegetation. Drawing by the lab.

Over grassland and crops the plants' share is small and can be allowed for. A forest holds so much water in its trunks, branches and leaves that little of the soil's signal gets through, and the standard soil moisture maps mark their values there as unreliable. Yet forests cover almost a third of the land.

The challenge

To tell the soil from the trees, one has to know how strongly the canopy weakens the signal and how much of it the canopy scatters. The scattering is usually treated as a fixed property of each kind of vegetation. But a forest changes through the year: leaves grow and fall, and the trees hold more water in a wet season than in a dry one. Changes of the canopy that are not allowed for are mistaken for changes in the soil.

The idea

For each place and day the satellite delivers two numbers: the brightness of the ground at vertical and at horizontal polarisation. Three things are wanted from them: the soil moisture, how strongly the canopy weakens the signal, called the vegetation optical depth, and how much of it the canopy scatters, called the scattering albedo. Two measurements cannot settle three unknowns. The usual algorithms therefore set the scattering in advance, one value for each kind of vegetation, and hold it constant.

The Hybrid Dual-Channel Algorithm, HDCA for short, drops that assumption. It starts from the physics of how microwaves pass through a canopy and includes the radiation that has been scattered once on the way. From this follows a link between the two unknowns of the canopy: the ratio of scattering to weakening goes with how much the two polarisations differ, which the satellite measures anyway. With that link as a third equation, all three unknowns can be found for every day, and the scattering is free to change through the year.

A diagram in two rows. The usual way: the brightness at two polarisations plus an assumed, fixed scattering gives soil moisture and the weakening by the canopy. This project: the same two measurements plus a link from physics give soil moisture, weakening and a scattering that may change through the year. Below: the record is read twice, first to find what is usual for each place, then each day again with the usual as a guide
What the satellite measures, what has to be added, and what can then be found. The usual way adds an assumption; this project adds a link that follows from the physics. Drawing by the lab.

The whole record is then read twice. The first pass gives what is usual for each place: ten-day means and the normal of each month. In the second pass each day is read again with those values as a guide, so that a single noisy measurement cannot pull the result far from the days around it. The second pass is the published product.

What changes on the map
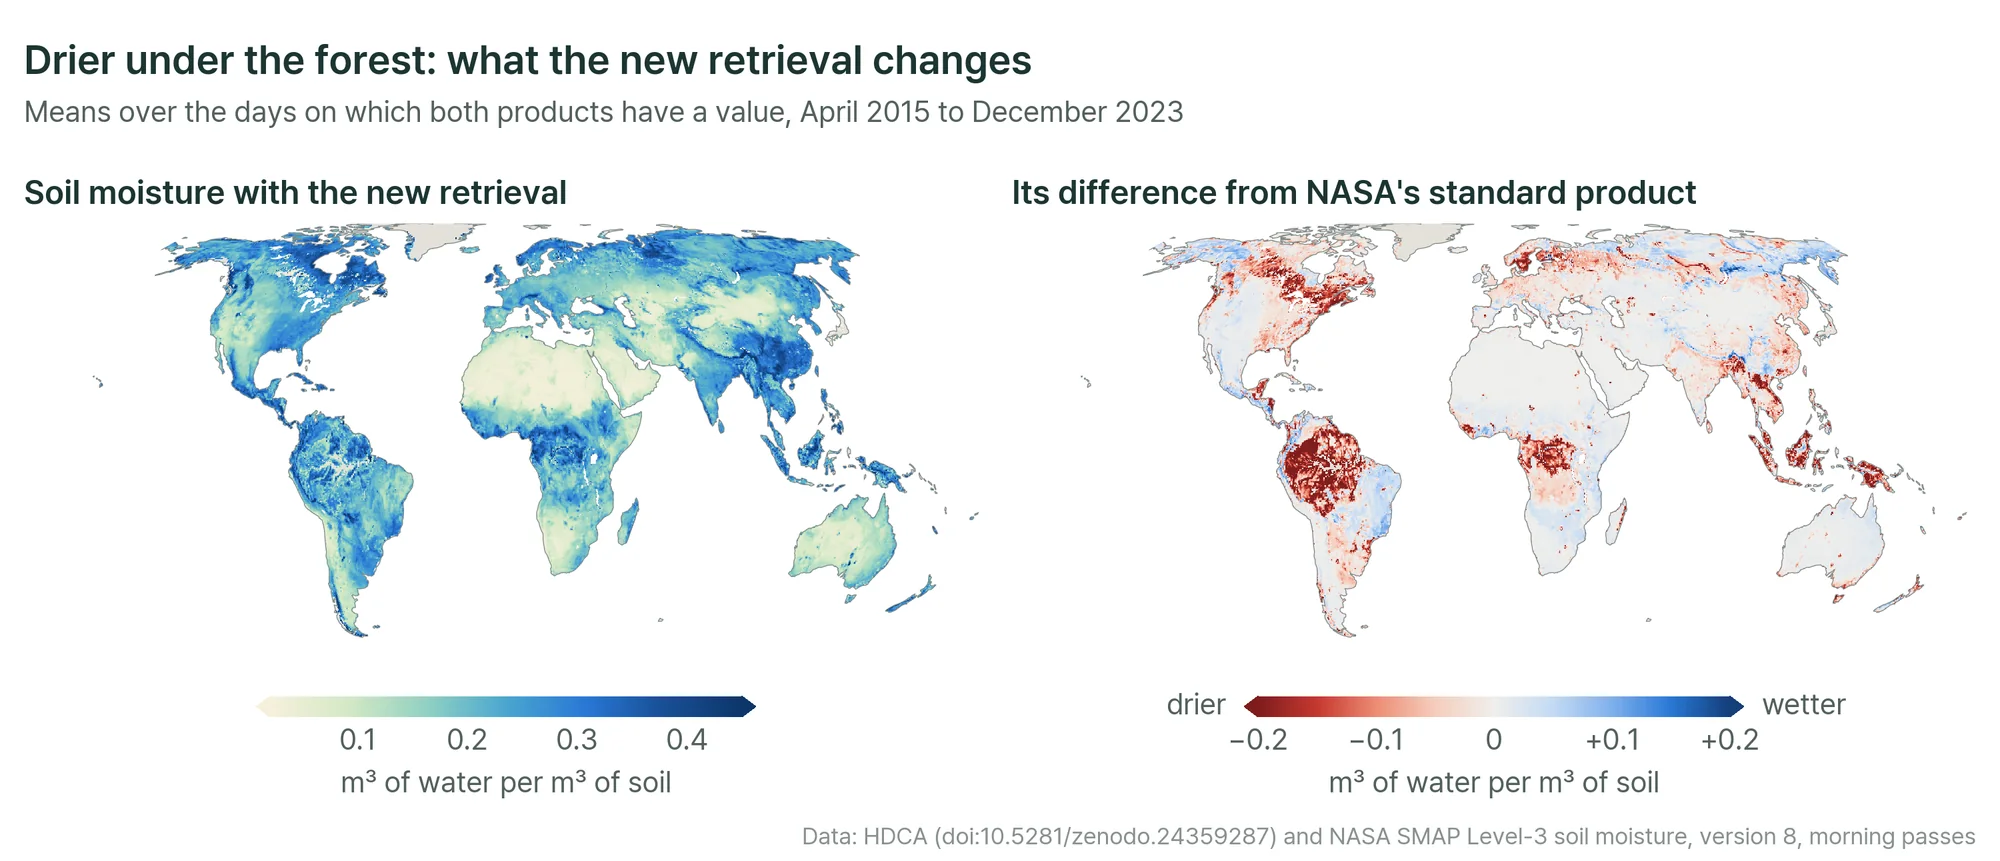
Two world maps: mean soil moisture from the new retrieval, and its difference from NASA's standard product, which is close to zero over most of the land and strongly negative over the Amazon, the Congo basin, South-East Asia and the forests of eastern North America
Left: soil moisture from the new retrieval. Right: how it differs from NASA's standard SMAP product. Where vegetation is light the two agree on average. Under the densest vegetation the new retrieval is drier by 0.12 m³ of water per m³ of soil, and over the Amazon it gives 0.24 where the standard product gives 0.41. Figure by the lab from public data: the lab's HDCA data and NASA SMAP Level-3 soil moisture.

The large pattern is the same in both: deserts dry, the humid tropics and the far north wet. The difference lies in the forests, where the new retrieval is drier. Part of what an algorithm with fixed scattering reads as soil that is always wet is in fact the canopy.

Checked against the ground

Time series and scatter plots of soil moisture at Millbrook, Massachusetts and Tambopata: the measurements in the ground as a black line, three existing satellite products that lie well above it under forest, and the new retrieval close to it
Three forest sites: Millbrook in New York, Harvard Forest in Massachusetts and Tambopata in the Peruvian Amazon. Black: soil moisture measured in the ground. Red: the new retrieval (HDCA). Blue, orange and green: three existing products from the same satellite (SCA-V, DCA and SMAP-IB). Figure 7 of the paper (Lee and others, Remote Sensing of Environment, 2027).

Soil moisture measured in the ground under forest is rare. Three sites allow a test. At Millbrook, where the forest is lighter, all products follow the seasons, and the new retrieval has the smallest bias, 0.008 m³/m³. At Harvard Forest the existing products are too wet by 0.18 to 0.30 and follow the ground only loosely, with correlations of 0.37 to 0.54; the new retrieval is too wet by 0.025 and reaches a correlation of 0.72. At Tambopata, in the rainforest, the existing products are too wet by 0.26 to 0.44, with correlations of 0.05 to 0.37; the new retrieval is too wet by 0.018 and reaches 0.51.

Away from forests little changes. At the core validation sites of the SMAP mission, most of them farmland and grassland, the new retrieval follows the ground as closely as the existing products and has the smallest random error, 0.031 m³/m³ on average.

Which part does what
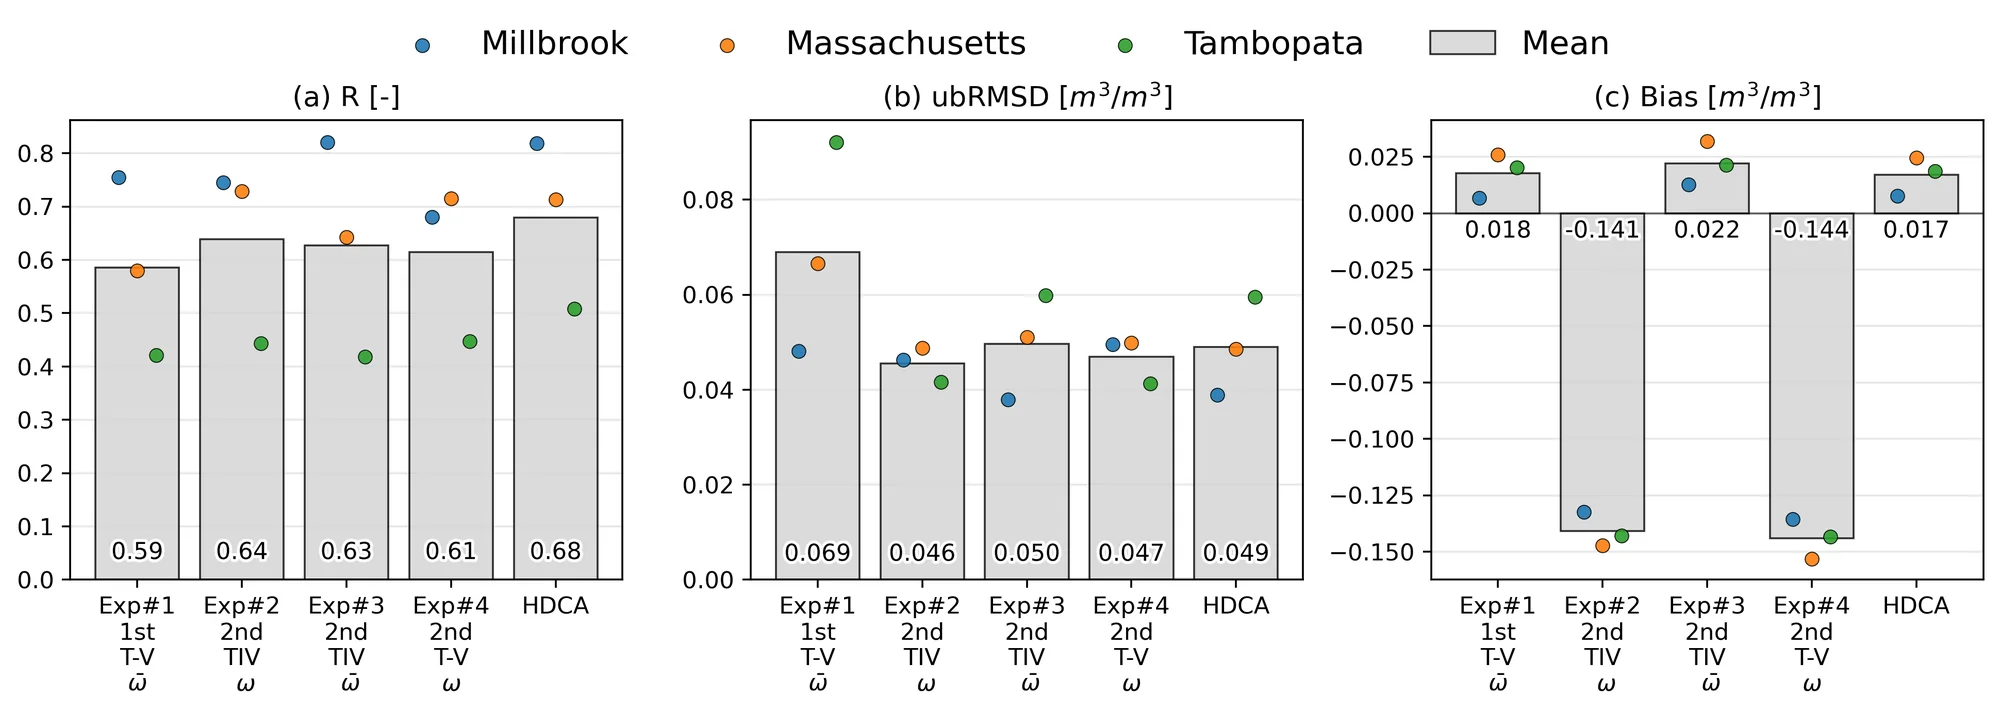
Three bar charts for five versions of the algorithm at the three forest sites: correlation, random error and bias. The complete algorithm has the highest correlation, and the versions without once-scattered radiation have a large negative bias
The algorithm with parts left out, at the three forest sites: how closely it follows the ground (a), its random error (b) and its bias (c). Experiment 1 is the first pass alone. Experiments 2 to 4 are second passes that leave out, in turn, both refinements, the change of scattering with time, and the once-scattered radiation. Figure 11 of the paper (Lee and others, Remote Sensing of Environment, 2027).

Leaving parts of the algorithm out, one at a time, shows what each is for. Reading the record twice makes the retrieval follow the ground more closely from day to day and lowers its random error. Counting the radiation that was scattered once removes a bias of about 0.14 m³/m³, towards dry in this set-up. And letting the scattering change with time matters most where the canopy is densest, at Harvard Forest and Tambopata.

The data and their limits

The product gives soil moisture, vegetation optical depth and scattering albedo for every day on the satellite's 36 km grid, for all land, from April 2015 to December 2025. It is open under a CC BY 4.0 licence and can be explored on the lab's data portal.

Three cautions go with it. A cell of 36 km averages many kinds of land. The quality has been checked at the sites named above and is not verified elsewhere. And the scattering albedo, which makes the soil moisture better, is not yet a tested vegetation product in its own right: there are no measurements on the ground to compare it with, so the paper could check it only indirectly.

Why it matters

Forests store much of the carbon on land and return large amounts of water to the air. Knowing how wet their soils are helps to follow drought and fire risk, and to see how forests respond to a changing climate. It also fills the largest blank on the soil moisture maps that weather and water forecasts rely on.

The paper

Lee, J., Yueh, S., Entekhabi, D., Colliander, A., Im, J., Park, C.-H., and Kim, H. (2027). Soil moisture retrieval for dense vegetation considering time-varying first-order scattering from SMAP L-band dual-polarized brightness temperatures. Remote Sensing of Environment, 349, 115787. The work was done with colleagues at NASA's Jet Propulsion Laboratory, the Massachusetts Institute of Technology, the Finnish Meteorological Institute, UNIST and Ajou University.

Links

Contact

Read other projects

A longer record of soil moisture, from an older radar

NASA's SMAP gives the most trusted soil moisture from space, but only since 2015. This published study turns the measurements of an older radar into SMAP-like maps of soil moisture and vegetation, back to 2007.

Read this project
Streamflow where the gauges are few

Most of the world's rivers have few gauges or none. A network that learns along the river, guided by an untuned model of the basin, predicts their flow. A published study in three countries.

Read this project
How storms carry water and carbon out of farmland

A model of a watershed and a neural network, used together, predict the streamflow and the organic carbon that storms wash out of farmland, without tuning the model. A published study.

Read this project
Soil moisture from reflected navigation signals

Eight small NASA satellites built to watch tropical cyclones also sense how wet the soil is, several times a day. A published review of what seven years of their data can and cannot do.

Read this project
A slow groundwater response as a sign of flash drought

How long does groundwater take to follow the soil above it? Where that delay is long, flash droughts are frequent. A published study of twenty years of global data.

Read this project
Forecasting flash droughts weeks ahead

A flash drought takes hold within a few weeks, often before a drought has been declared. This project asks how far ahead it can be seen coming, and where that foresight comes from.

Read this project
How well does artificial intelligence forecast rain?

Weather models built with artificial intelligence now match traditional forecasts for wind and temperature. Rain is harder. This project tests how well they forecast it, from the next day to several weeks ahead.

Read this project
Soil moisture under the forest canopy

Satellites read the moisture of the soil almost everywhere on land, except under dense vegetation. This project developed a way of reading it under forests too, with open daily maps of the globe.

Read this project
Reading rainfall from the soil

Rain leaves a mark in the soil: after a storm, the ground is wetter. This project uses that mark, as satellites see it, to estimate how much rain fell.

Read this project
Can satellites give early warning of a slope collapse?

After a mountainside collapses, satellites are often said to have seen it coming. This project looks at what satellites can really observe on a steep, remote slope, and when.

Read this project
The water cycle on land, seen as a whole

Rain falls, part of it evaporates, part runs off, and the rest is stored. Each part is observed by different satellites; this project works on learning them together.

Read this project
How flood water changes the air above it

When a river floods, land turns into open water for days or weeks. This project asks how the lower atmosphere responds.

Read this project
Seeing rain from space to forecast the next hours

Where is it raining now, and where will it rain in the next hours? This project brings fresh satellite views of clouds and rain into artificial-intelligence weather forecasts.

Read this project
Flash droughts that reach groundwater

Some droughts arrive within weeks rather than seasons. This project asks whether such flash droughts stay in the soil or reach the groundwater below.

Read this project
How far ahead can soil moisture be predicted?

Next week's weather is hard to predict; the wetness of the soil is easier, because soil remembers. This project studies how far ahead soil moisture can be forecast around the world.

Read this project
Filling the gaps in satellite soil moisture

Satellite maps of soil moisture are full of holes. This project works on filling them, so that the maps are complete in space and time.

Read this project
How wet soil turns rain into floods

How wet the ground is before a storm decides how much of the rain runs off. This project asks when knowing soil moisture from satellites makes a flood forecast better.

Read this project
Evapotranspiration at the scale of single fields

How much water a field gives back to the air decides how much irrigation it needs. This project works on maps that tell one field from the next.

Read this project
Bringing satellites and models together to follow soil moisture

A satellite sees soil moisture only where it passes, and a model can only estimate it. This project works on combining the two, and on finding out which future observations would help most.

Read this project
Root-zone soil moisture: below what satellites see

Satellites sense soil moisture near the surface, while plants draw water from the root zone below. This project estimates what lies below from what satellites see.

Read this project
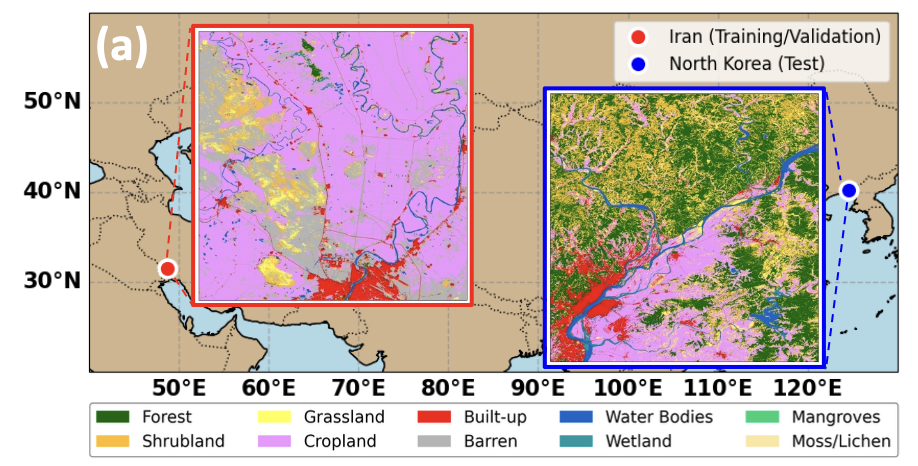
From Iran to North Korea: Investigating Flood Impacts with AI and Satellite Data Sets

This project focuses on improving weather prediction by integrating multiple satellite-based soil moisture observations into a coupled land-atmosphere modeling system. By combining radar and radiometer data, it aims to better capture land surface conditions and their influence on atmospheric processes. The project seeks to enhance predictions of temperature, humidity, and precipitation through more accurate and physically consistent representation of soil moisture dynamics.

Read this project
Multi-Sensor Satellite Data Assimilation for Numerical Weather Prediction

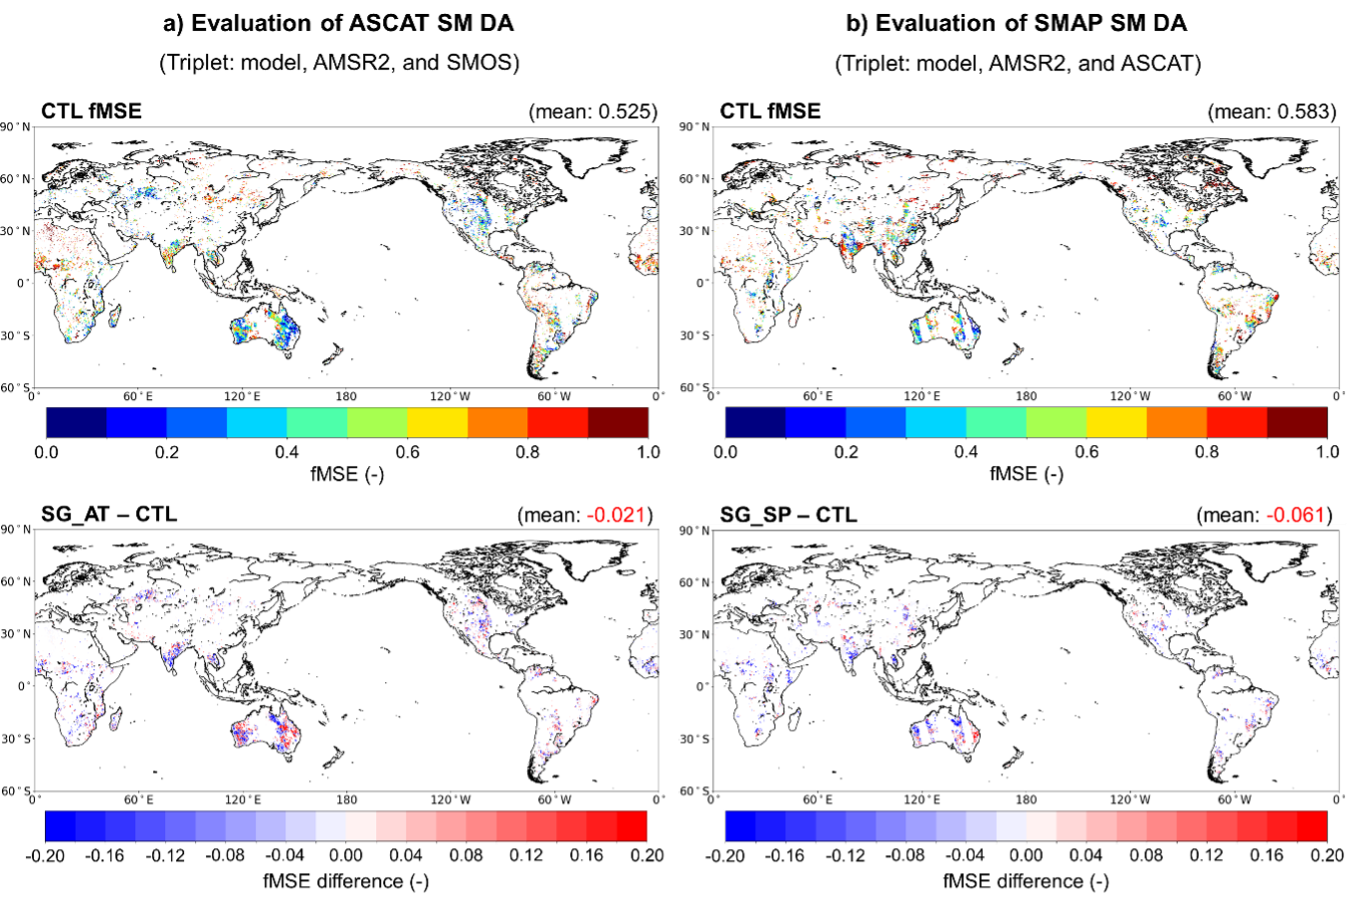
This project focuses on improving weather prediction by integrating multiple satellite-based soil moisture observations into a coupled land-atmosphere modeling system. By combining radar and radiometer data, it aims to better capture land surface conditions and their influence on atmospheric processes. The project seeks to enhance predictions of temperature, humidity, and precipitation through more accurate and physically consistent representation of soil moisture dynamics.

Read this project
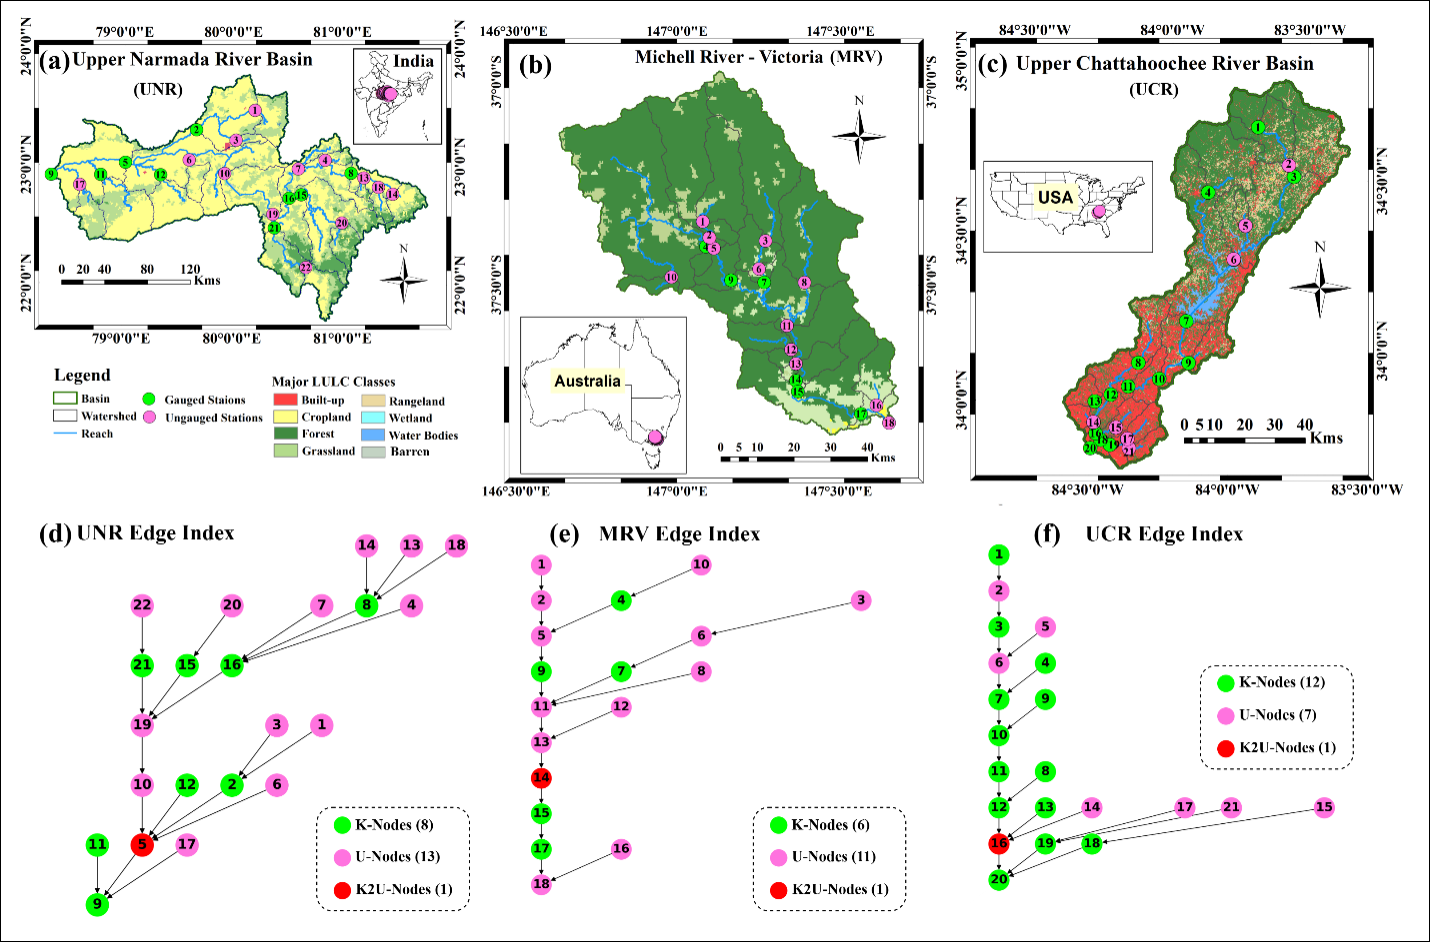
AI and GNN-Based Streamflow Prediction in Data-Sparse and Ungauged Basins

This project focuses on advancing streamflow prediction in data-sparse and ungauged basins using AI and graph neural networks. By capturing spatial relationships between river networks and hydrological processes, it aims to overcome limitations of traditional models that rely on dense observations. The project seeks to improve prediction accuracy and generalization across regions, enabling more reliable water resource management and flood forecasting.

Read this project
AI-Driven Water Body Detection Using Satellite Constellations and SAR: A GNSS-R and Sentinel Fusion Approach

We are developing an AI based water body detection system that combines CYGNSS satellite constellation data with Sentinel optical and SAR observations. CYGNSS provides all weather and high frequency measurements, while Sentinel offers detailed spatial information. By applying AI based fusion and classification, our approach identifies both permanent and temporary surface water even under clouds, vegetation, or limited ground monitoring. This research supports flood response, drought assessment, and improved water resource management in data denied regions.

Read this project
Building Koreas First NASA Core Validation Site for Advanced Earth Observation Satellites

-

Read this project
WRF-Hydro and AI: Advancing Hydrological Modeling with Next-Generation Tools with AI

-

Read this project
Physics-Informed Large AI Models for Hydrology and the Water Cycle

-

Read this project
Multi-Scale Soil Moisture Monitoring Using ELBARA-III and Drone Radiometer

The Portable L-Band Radiometer, mounted on a drone, enables high-resolution soil moisture retrieval across diverse terrains. Operating at 1.4 GHz (L-band), it collects brightness temperature (TB) data over rice paddies and varied vegetation zones, complementing satellite missions like SMAP and SMOS. By integrating airborne observations with ground-based sensors, the system enhances spatial coverage and improves soil moisture retrieval models for climate and agricultural applications. This drone-based approach significantly increases data accuracy and efficiency compared to traditional methods.

Read this project
Developing the Long-Term Brightness Temperature Measurement Site in South Korea

Soil moisture (SM) is essential for agriculture and hydrometeorology but difficult to measure. To improve validation, Korea’s first Core Validation Site is being built in Hampyeong-gun and Naju-si with TEROS sensors, ESA’s ELBARA-III radiometer, and drone-based PoLRa. The site will provide continuous SM and temperature data, advancing satellite validation, retrieval models, and climate resilience research.

Read this project
AI-Based Water Quality Prediction for Inland Water using Satellite and Land Surface Model Data

Climate change-driven heatwaves and water cycle disruptions threaten inland water quality (WQ), necessitating efficient monitoring. Traditional methods are labor-intensive with limited coverage, prompting us to develop an AI-based model for predicting chlorophyll-a concentrations in lakes and rivers. By integrating high-resolution satellite imagery (Landsat-8/9, Sentinel-2/3) with land surface models (ERA5-Land, GLDAS, MERRA-2), our model tailors predictions to different water bodies. Future plans include incorporating socio-statistical data (e.g., population, livestock) and climate scenarios (RCP, SSP). Using AI, GIS, and high-performance computing, we explore low-concentration chlorophyll-a prediction, precipitation and flow speed impacts on WQ, transfer learning, multi-sensor data fusion, and uncertainty quantification. Beyond chlorophyll-a, we aim to extend predictions to turbidity and dissolved oxygen, providing a comprehensive AI-driven approach to monitoring and mitigating climate change effects on inland water quality.

Read this project
Harnessing Deep Learning to Predict and Decode the Mysteries of Flash Droughts (GAN/SHAP/3D-CNN with Transfer Learning)

The application of deep learning in predicting flash droughts offers a transformative approach to understanding and anticipating these rapid-onset events, significantly enhancing preparedness and response strategies. By unraveling the complex mechanisms behind flash droughts, this project aims to provide precise, timely forecasts, thereby mitigating the severe agricultural, ecological, and socioeconomic impacts associated with these phenomena.

Read this project
Streamflow and Drought Predictions over Ungaged Regions using Deep and Transfer Learning Approaches

Streamflow and flash drought predictions are essential for managing water resources and mitigating potential disasters in ungaged regions. With remotely-sensed data, deep and transfer learning approaches provide powerful tools to analyze complex hydrological data, enabling more accurate predictions and better decision-making in these areas.

Read this project
Applications of Bayesian Machine Learning in Big Data in Earth Science

Bayesian methods help us improve our guesses by using new information. In Earth science, these methods are applied to big data to better understand our planet. This approach is useful for predicting things like natural disaster patterns and climate changes. By continuously updating our knowledge with new data, we can make more accurate predictions and decisions in Earth science.

Read this project
Water Balance Budgeting with Bayesian Machine Learning

The water balance equation in Earth science, P = E + R + etc, describes the relationship between precipitation (P), evaporation (E), runoff (R), and etc (e.g., soil moisture, ground water) in a given area. Bayesian inference can be applied to solve this equation by incorporating prior knowledge and updating the probability distributions of the variables based on new data, ultimately improving water resource management and prediction.

Read this project
Integrating Earth Science and Engineering for Climate Resilience: Innovative Approaches to Infrastructure and Societal Justice

Earth science informs infrastructure development by providing insights into site suitability, resource management, and sustainable design, enhancing the resilience and long-term viability of projects. It also plays a crucial role in addressing societal justice related to climate change by helping identify vulnerable communities and develop mitigation strategies, ensuring equitable access to resources and protection from environmental hazards.

Read this project
Enhancing Earth Science Predictions through Advanced Data Assimilation Techniques

Data assimilation is vital in earth science as it integrates diverse observations and model simulations, improving the accuracy of forecasts and predictions. This process enhances our understanding of complex Earth systems, enabling better decision-making for environmental management and climate adaptation.

Read this project
Floods and Droughts Predictions using Machine Learning Approaches

Satellite data and machine learning transformed Earth science by predicting and monitoring natural disasters. This combination delivers precise and timely predictions, crucial for mitigating the impacts of events like floods and droughts.

Read this project
Data Error Characterizations

Characterizing the error of satellite data and land surface models is vital in Earth science, as it ensures the accuracy and reliability of information used for monitoring and predicting environmental phenomena. By understanding these errors, scientists can refine data interpretation, enhance models, and ultimately make better-informed decisions about the Earth's complex systems.

Read this project
Developing Algorithms to Improve the Temporal Sampling of Satellite Data

Enhancing the temporal repeat of satellite data for obtaining soil moisture information is a vital research area due to its implications for agriculture, water resource management, climate change research, and ecosystem health. It helps in making informed decisions, increasing productivity, and reducing the impact of natural disasters, as well as contributing to our understanding of the global climate system.

Read this project
Exploring the Impact of Human Activities on the Subdaily Global Terrestrial Water Cycle

Humans have been modifying the Earth's surface for thousands of years, with practices like clearing forests for agriculture and creating uniform land covers. But how do these changes impact the subdaily global terrestrial water cycle? That's the question a project aims to answer.

Read this project
Satellite Image Disaggregation with Machine Learning

Microwave soil moisture data is critical for agriculture, weather, and climate modeling, but has low spatial resolution. Disaggregation via machine learning can improve resolution, offering detailed local soil moisture data. Machine learning can handle complex relationships between microwave signals and soil moisture.

Read this project